UTMB race text-data
To mentally prepare for an upcoming trail running race I scraped data from the largest trail running organization, the UTMB, and published the data & code on Kaggle. In this post I describe the source, present the ”Race Finder” application and present some insights.
Source description
Trail running races are much like regular road running races except that they are off-road by definition, and generally longer than your typical road race. The premier global trail running race is the Ultra-Trail du Mont-Blanc, held in Chamonix-Mont-Blanc, France. It is a 174 km (108 mi) race with 10,000 m (33,000 ft) of elevation gain that is won in about 20 hours. This race is organized by the UTMB Group. In addition to the UTMB, they organize 40+ prominent races across Asia, Oceania, Europe, Africa, and the Americas called the “UTMB World Series”. Their website UTMB.world contains the results of these events. But to my surprise, it also contains the results of thousands of other trail running races. Since their website displays results using simple pagination, and not state-based systems, it was easy to scrape data from the site using Beautiful Soup.
Applications
Have a look at the data scraped through the UTMB Race Finder below or in full screen. This tool can help you manage expectations by reviewing historic data or help you find a race to participate in.
Managing expectations
Trail running races vary a lot more than road running races. This makes estimating the challenge of a race more difficult. Factors you will have to consider in addition to the distance include the elevation gain, terrain type, and climate. Setting the right expectations can substantially improve race preparation and race outcome.
For example, this data would have helped me in my first UTMB race, the X-Traversee. The X-Traversee starts at 8 am, and I was hoping to finish the 76km race before sunset, in about 12 hours, a reasonable 6km/hour, right? This data, however, would have told me that this would have put me in the top 4% of runners, pretty ambitious for a first-timer from a flat country. The data would have told me that finishers take 17 hours on average. The unsuspected climb and finish in the dark were mental blows that this data could have prevented.
Finding a race
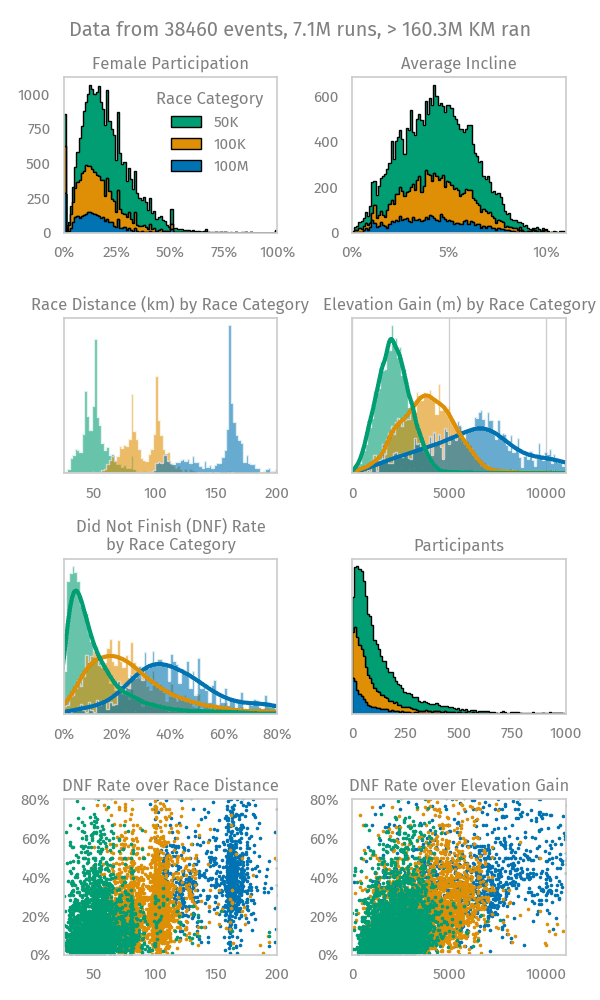
Finding the right UTMB race involves navigating a vast array of options, as the UTMB Race Finder includes data from 19,894 unique races worldwide. With such variety, it’s essential to consider more than just distance: factors like elevation gain, DNF rate, continent, country, and race category (50K, 100K, or 100M) are critical to making the right choice. The UTMB World Series offers over 40 flagship races, but the Race Finder helps you explore thousands more, allowing you to filter by key criteria to match your fitness level and experience.
Insights
Before diving into the detailed data and tools I’ve developed, here are some of the most interesting facts I uncovered during my analysis. From the steepest inclines to the races with the longest distances, these highlights give a sense of just how much trail races vary worldwide.
| Category | Race name | Amount | Link |
|---|---|---|---|
| Steepest average incline | Vertikal K3 Bei 2019 | 30.6% | 🔗 |
| Longest distance | Great Himal Race 2017 | 1,355 km | 🔗 |
| Shortest distance | Amangeldy Race 2023 | 6 km | 🔗 |
| Most elevation gain | Great Himal Race 2017 | 80,230 m | 🔗 |
| Longest mean finish time | Great Himal Race 2017 | 415.3 hours | 🔗 |
| Shortest mean finish time | GIIR DI MONT 2022 | 0.9 hours | 🔗 |
| Highest DNF Rate | Mad Fox Ultra 2019 | 89.3% | 🔗 |
| Largest portion of female participants | QUEEN of the JUNGLE 2017 | 85.7% | 🔗 |
| Most participants | La SaintéLyon 2017 | 6,740 | 🔗 |
| Longest race time recorded | Great Himal Race 2017 | 500.0 hours | 🔗 |
| Most international race | UTMB® Mont Blanc 2022 | 83 countries | 🔗 |
Exclusion criteria: < 10 participants, < 10 finishers, uncategorized races, female exclusive races, < 1km race distance, mean finish time of 0 hours, last finish time < 10 * mean finish time
Data Availability
The source file behind this cleaned file is 187MB. It contains the individual finish times required to generate the histograms shown in the UTMB Race Finder, and the frequency of countries of origin. The source data file is not publicly available due to its size. Please get in touch if you are interested in using this file.
To reduce file size, I aggregated individual finish times to “Mean Finish Time”, “Winning Time”, “Last Time”, and country of origin to “N Countries”. This reduces the file to 3.7MB that you can download here utmb_sheet.csv. In addition, I have published the data on Kaggle. Here is some important information about this file containing race meta data:
- Columns: Race UID, year, Race Title, N Participants, Race Category, Distance, Elevation Gain, Mean Finish Time, Winning Time, Last Time, N DNF, N Women, N Countries
- The data set consists of 19,894 races (=unique Race UIDs) and 38,461 events (=unique Race UID & year), held between 2014 and 2025 from utmb.world
- Each row can be traced back using the URL: https://utmb.world/utmb-index/races/RACE_UID..YEAR, e.g., https://utmb.world/utmb-index/races/10001..2017
- In this data set, there are no other genders than male or female so you can assume that “N Men” = “N Participants” - “N Women”
- Participants that DNF’d were excluded from the mean finish time.
I have attached the code that I used to scrape this data as notebook to the Kaggle data set: Scripts used in UTMB data collection
Conclusion
The data and code are on Kaggle, and the Race Finder is live at /utmb-gui. Get in touch if you have questions or ideas for what else the data could answer. Good luck, and happy trails!
Comments