Measuring the retina
Optical coherence tomography (OCT) uses light to build cross-sections of the retina at micrometer resolution. In Risseeuw et al. 2020 we used it to measure something nobody had quantified before: the calcification of Bruch’s membrane in patients with Pseudoxanthoma Elasticum (PXE), a rare genetic disorder that can cause blindness. The headline result is a reflectivity ratio that tells patients with PXE apart from healthy controls with an AUC of 0.85. This post is the story behind that number, including the two weeks where my very first attempt to repeat a “simple” measurement fell apart completely.
I will go through what PXE actually is, why the patients stuck with me, why OCT is such a remarkable tool, the replication that fell apart, how we fixed it, one open question about OCT physics that still bugs me, and what we found.
What PXE actually is
Pseudoxanthoma Elasticum is a rare genetic disorder, around 200 people have it in the Netherlands, and it is autosomal recessive: you need a broken copy of the ABCC6 gene from both parents to get it. That is why it clusters in specific regions of the country, the same founder-effect pattern you see with other recessive disorders in communities with a shared genetic history.
What it causes is calcification of elastic fibers throughout the body. Elastic fibers are everywhere, so the disease shows up everywhere: in the skin, in the arteries, and in the eyes. Even within the same family, how badly someone is affected varies a lot. In the arteries, calcified fibers are less elastic and more prone to rupture, which is one of the reasons pregnancy in patients with PXE needs closer monitoring. Side note: none of this is medical advice, if you or someone you know has PXE, talk to an actual doctor.
The eye has its own version of this problem. At the back of the retina sits Bruch’s membrane, a layer just 2 to 5 micrometers thick, rich in elastic fibers, sitting between the retinal pigment epithelium and the choroid. When it calcifies, it can rupture. A rupture there can trigger abnormal blood vessel growth (choroidal neovascularization), which leads to scarring, and scarring in that part of the eye means permanent vision loss.
Around the time of this project, there was early evidence that a bisphosphonate drug, already known to reduce arterial calcification on CT scans, might also work on Bruch’s membrane. If we could reliably measure BM calcification, we would have a way to test whether the drug actually protects vision, not just arteries.
Why the patients stuck with me
The University Medical Center Utrecht is the Dutch national reference center for PXE, so during this project I got to do measurements on a lot of actual patients, not just look at anonymized data. What struck me first was how grateful they were. People traveled in for these scans and were genuinely happy that someone was specifically studying their disease. That kind of attention is rare for a condition this uncommon, and it changed how I thought about the project.
The second thing that stuck with me: PXE affects elastic fibers everywhere, brain, arteries, skin, all of it, but the patients were consistently most worried about their vision. I still think about that sometimes. Out of everything your body does, vision is probably the one function most people would protect above all others if they had to choose.
Why OCT is such a remarkable tool
Here is what that all looks like in practice. A healthy retina on OCT has smooth, well defined layers running parallel to each other. In a PXE retina, that structure gets messy: bright, disrupted spots show up and the layers become harder to tell apart.
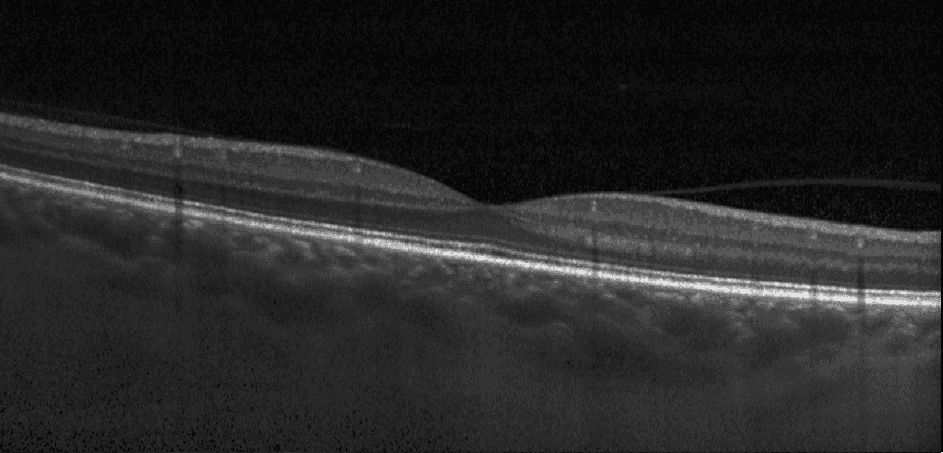
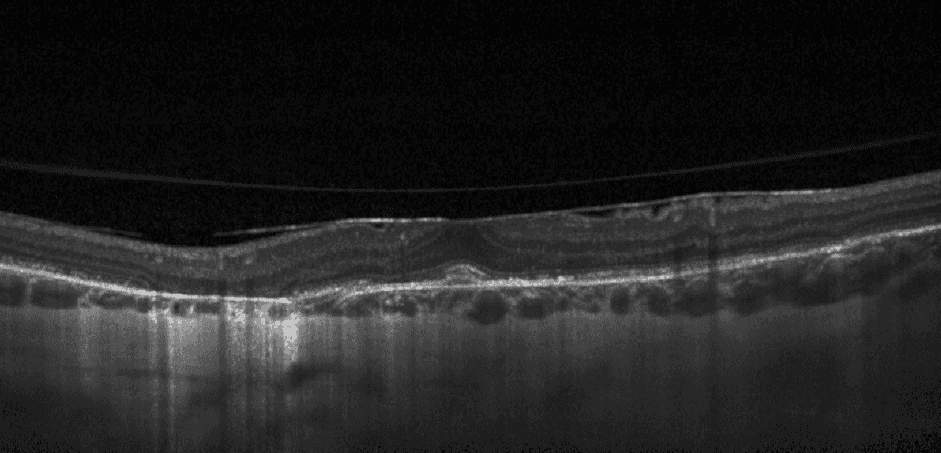
This project also left me with a real appreciation for OCT as an imaging technique. It works because there happens to be a clear liquid body sitting right in front of the retina, which lets light through with almost no scattering. That is not something you get anywhere else in the body, which is why OCT has not become a general-purpose imaging tool the way CT or MRI has. But for the one place it does work, the eye, it delivers micrometer accuracy on tissue that is directly responsible for something as important as eyesight, at the resolution you see above. We are lucky to have an imaging technique this precise for exactly the organ where it matters most.
The replication that fell apart
I was doing a three-month internship as part of my Technical Medicine degree at the University of Twente, supervised by Sara Risseeuw, Jeannette Ossewaarde-van Norel and Redmer van Leeuwen at UMCU’s ophthalmology department, with Edwin Bennink on the technical side and Ferdi van der Heijden supervising from Twente. When I arrived, the department had already hand-traced the retinal layers on a set of OCT scans, and found that the Bruch’s membrane layer looked more reflective, brighter, in patients than in controls. That matched the expectation: more calcification means more reflectivity means a brighter signal in the image.
My job was supposed to be a simple automation task: take that manual measurement and turn it into something that ran on its own. I could not reproduce it. Not in a subtle way, in a completely-different-result way, and I found this out in my first one or two weeks.
What had actually happened was a measurement artifact. In the control scans, the traced Bruch’s membrane line sat much further down in the image than in the patient scans. OCT images get darker toward the bottom of the frame. So the controls were not less reflective at Bruch’s membrane, their Bruch’s membrane just happened to be drawn in a darker part of the image. The “PXE patients are more reflective” result was, at least in part, an artifact of where the line was drawn, not what was actually there.
So two weeks into a three-month internship, we started over.
Straightening the retina
The retina is curved, and its layers vary in thickness from person to person and scan to scan. If you want to compare reflectivity at a specific depth across many people, you cannot just measure pixel rows, you need to normalize position within each layer first.
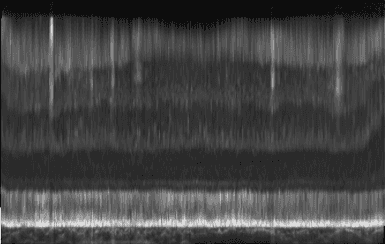
What I built was, conceptually, simple: an automated pipeline that first segments all the retinal layers, then rectifies, straightens, each one to a standard length using linear interpolation, so every layer occupies the same relative position regardless of where it originally sat in the raw image. Only once the retina is straightened this way can you compute a fair reflectivity profile through its depth.
Segmentation comes first: every one of the ten retinal layers, down to Bruch’s membrane at the very bottom, gets delineated separately.
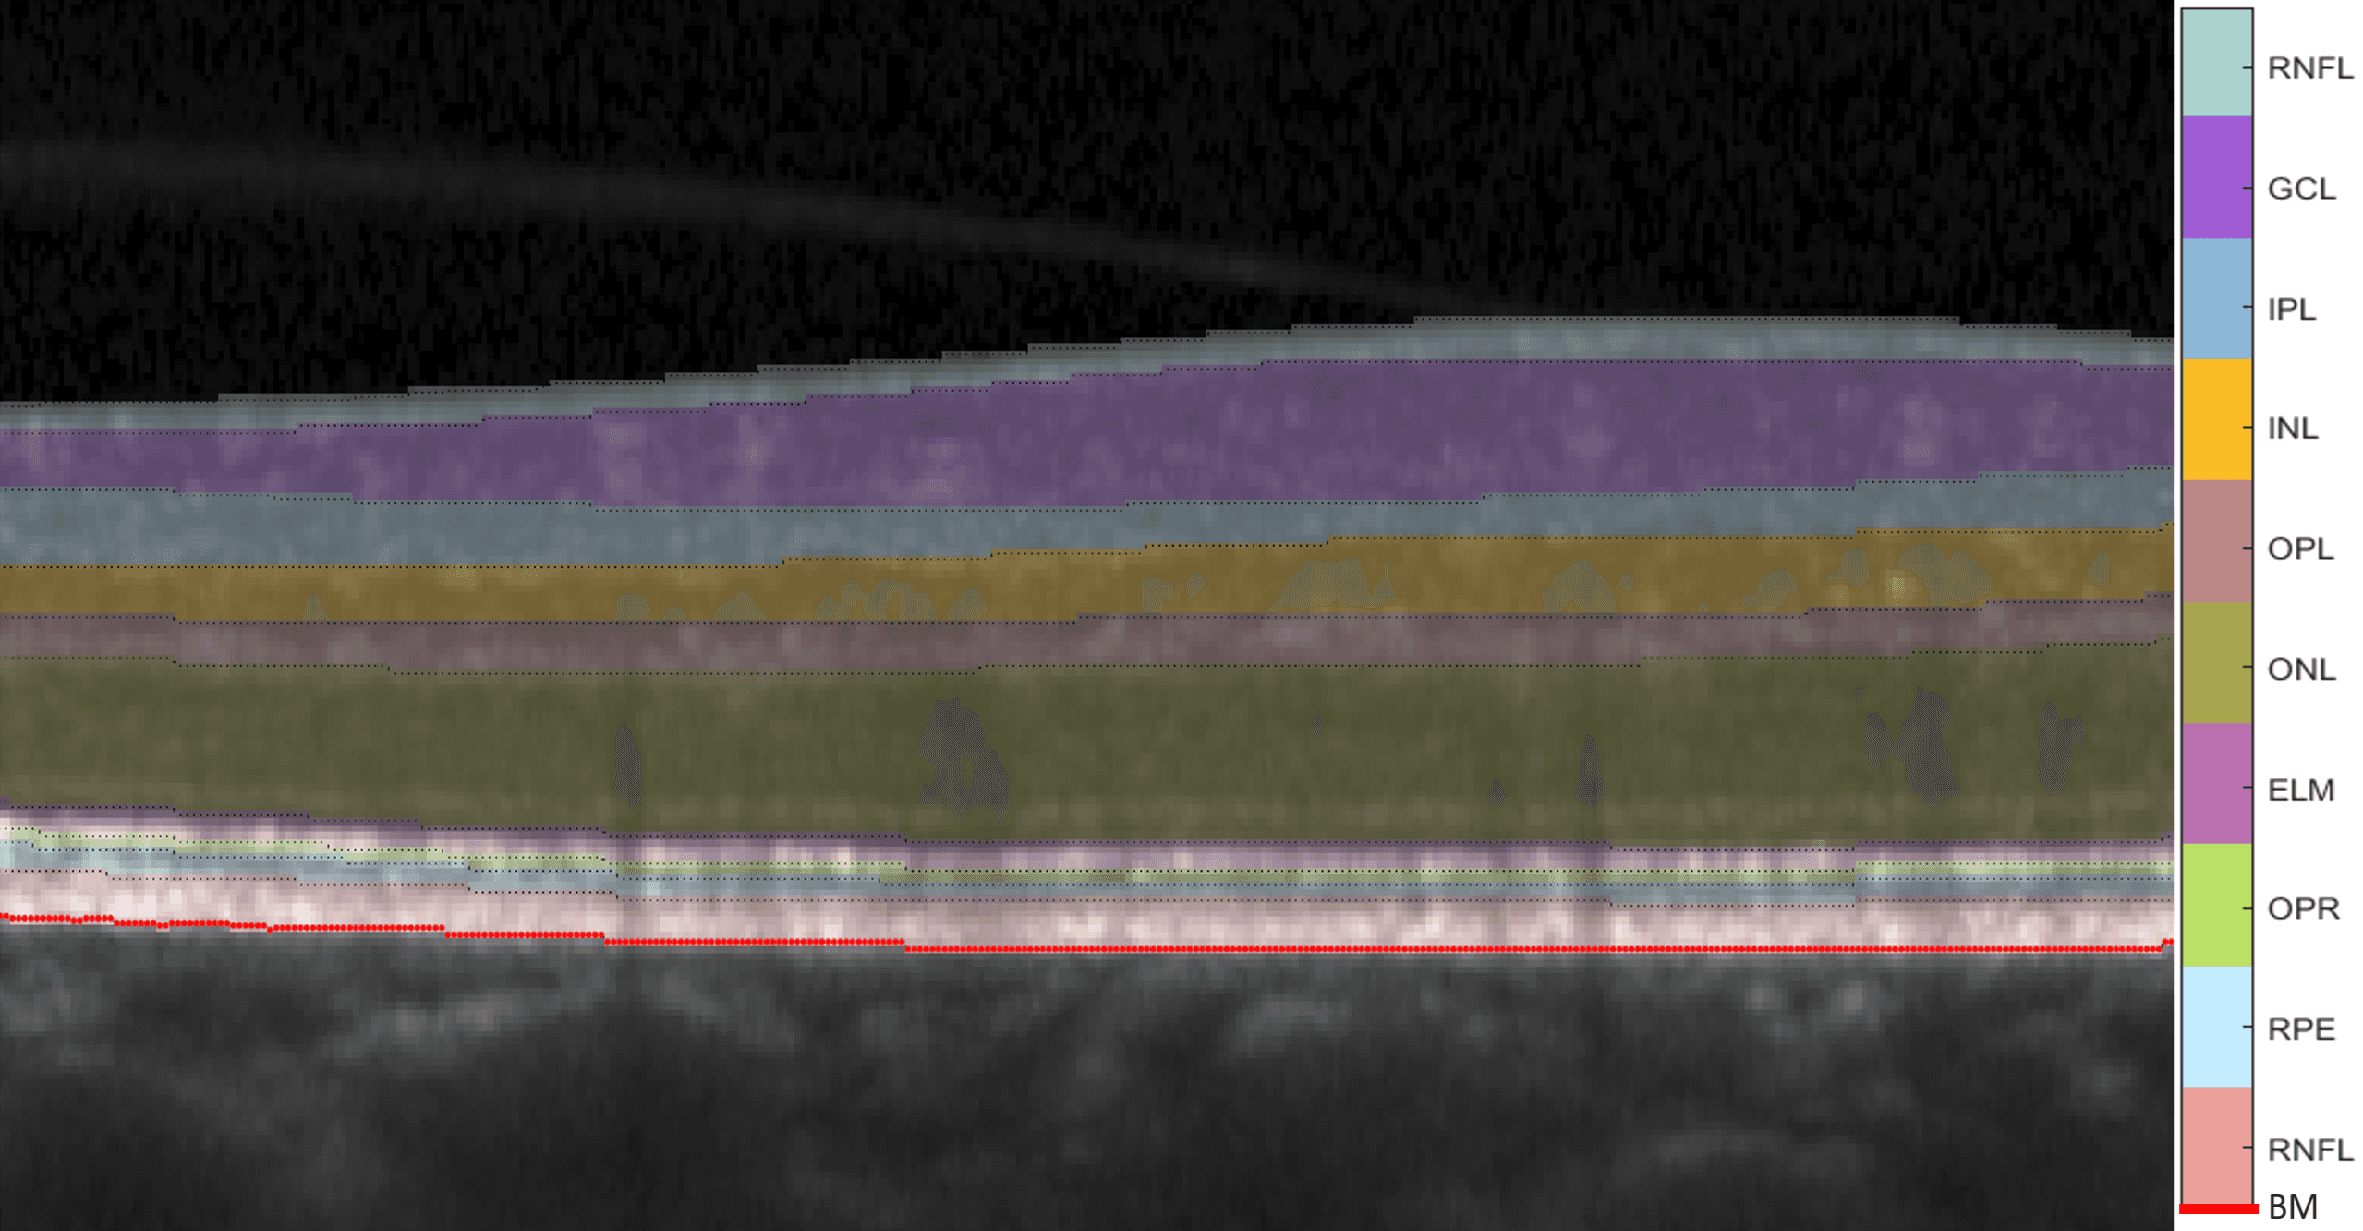
In healthy retinas this segmentation is straightforward, the layers are clean and the readers agree on where they are. In PXE, it is a different story: the layers are disrupted enough that graders often disagreed, and in the worst scans there was barely any structure left to segment at all. From what I remember, we could reliably segment somewhere around 99 percent of the healthy scans and something like 82 percent of the PXE scans, though that specific number is from memory rather than the paper itself.
Once segmented, each layer gets stretched to a standard length and the whole retina is straightened out:
An open question
There is one thing about OCT I never managed to work out, and it still bothers me. Even in a healthy retina, if something in the front layers attenuates light more strongly, you get a shadow further back, simply because less light makes it that deep to be reflected. That shadow is a physical side effect of the top layers, it should have nothing to do with the actual state of Bruch’s membrane underneath, yet it still affects what you measure there.
I never found a physically grounded way to undo that shadowing effect. In healthy retinas it is a minor effect. In PXE, where the whole retina can be disrupted, the attenuation from the layers above compounds, and correcting for it properly would likely sharpen the measurement further. If anyone reading this understands the physics of OCT attenuation well enough to have a real answer, I would like to hear it.
What we found
Part of the practical answer to that shadow problem turned out to be the same trick we needed anyway: measuring in relative terms. If a shadow from the layers above dims everything beneath it by roughly the same amount, then comparing a layer’s reflectivity to a nearby reference layer instead of to an absolute scale cancels out a good part of that shared dimming, even without a physical model of the attenuation itself.
So once we had straightened profiles we could actually compare, we tried several ways to quantify the reflectivity of the RPE-Bruch’s membrane complex. The one that won was the peak reflectivity of that layer, normalized to the ganglion cell and inner plexiform layers as a stable reference. It beat using the median reflectivity of the same layer, and it beat the naive, unnormalized comparison that started this whole detour.
| Patients with PXE (n=45) | Controls (n=25) | |
|---|---|---|
| Mean age | 27 ± 7 | 27 ± 6 |
| RPE-BM peak reflectivity (normalized) | 67.5 | 32.7 |
| RPE-BM median reflectivity (normalized) | 41.1 | 22.5 |
Reflectivity is normalized to the ganglion cell and inner plexiform layers; values are medians. Source: Risseeuw et al. 2020.
Patients with PXE had roughly twice the peak reflectivity of controls, and that single number discriminates the two groups with an AUC of 0.85. It did not increase significantly with age within our under-40 cohort, though there was a visible upward trend. That the intensity of retinal layers might change with age at all was not something we set out to find, and I have not seen much literature on it since.
One thing I thought about a lot afterward: we lost more data to segmentation failures in the PXE group than in the healthy group, so could that selection bias explain the difference we found? I do not think so. The excluded regions were not concentrated in any particular part of the retina, and there is no reason position along the retina would systematically inflate intensity in one group over the other. The real limitation is just sample size, there are only a couple of hundred people in the Netherlands this can even be measured in.
What started as a two-week detour ended up as Risseeuw et al. 2020, and it gives PXE researchers something they did not have before: a number that tracks Bruch’s membrane calcification instead of just describing it. If it holds up in follow-up work, it is a plausible way to tell whether a systemic treatment is doing anything for the eye before someone’s vision is actually at stake. If you know more about OCT attenuation physics than I managed to figure out, or just have questions about any of this, I would like to hear from you.
Comments